
Lesson 5
Read the candle before the pattern
Identify open, high, low and close, and understand what a candle cannot tell you.
Study time: about 8m
Lesson
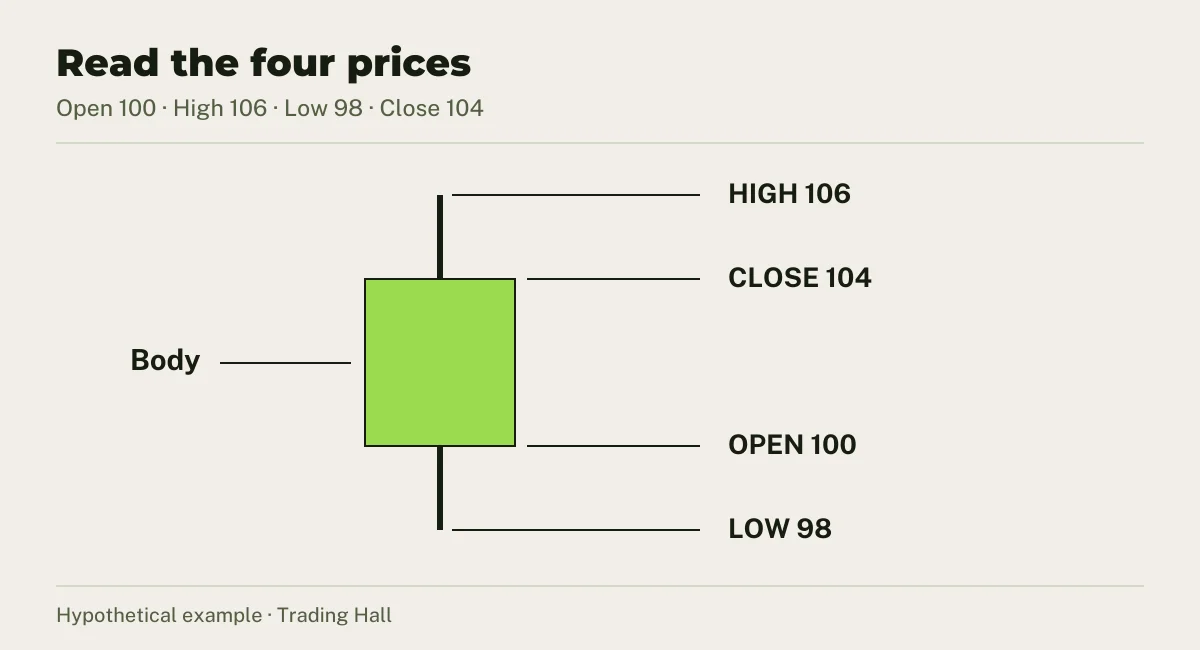
A standard time-based candle summarizes four prices within an interval: open, high, low and close. The body spans open to close; the wicks extend to the interval’s extremes. Colour is a display convention, so verify whether your chart colours candles by close versus open or another setting.
A five-minute candle and a one-hour candle describe different intervals of the same market. Use a consistent context timeframe and an execution timeframe for an exercise. Switching intervals until you see the signal you want changes the question halfway through.
OHLC data does not reveal the exact order of every price inside the candle. If both a stop and target appear inside its high-low range, that candle alone may not tell you which was hit first. A long lower wick records an excursion and recovery; it does not prove who traded or predict the next candle.
Worked example
A candle opens at 100, reaches 106, trades as low as 98 and closes at 104. Its body is 4 points, upper wick 2 and lower wick 2. The full range is 8 points. Closing above the open describes the completed interval, not tomorrow’s direction.
Try it in replay
Draw a second candle with open 104, high 105, low 99 and close 100. Label the body and both wicks. Can you infer whether 105 or 99 happened first?
Check your reasoning
The body spans 100–104, with a 1-point wick at each end. The range is 6 points. The four prices alone do not tell you the intrabar path.